Possible Thermal Plume (Urban Heat Island) RADAR Signature Over Metropolitan
Medford - Ashland, Oregon and Minneapolis - St. Paul, Minnesota
Effecting the Type of Precipitation as Seen from Weather Doppler Radar
(anticipated full release, late fall 2017)
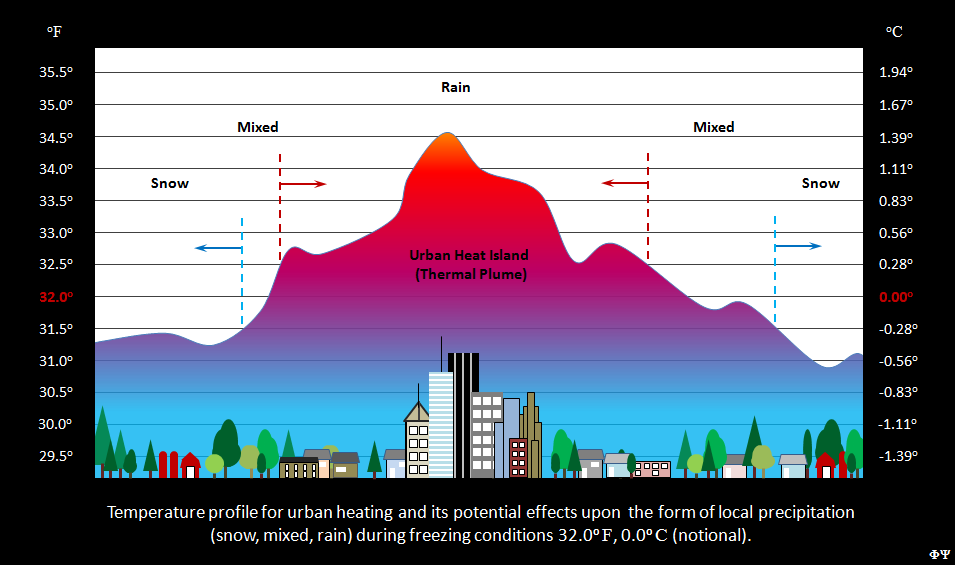
(Fig. 1) Cross section illustration of notional (McGraw, 2014) temperature plot resulting from a urban heat island (xxxx, xxxx)[01] during freezing conditions. The temperature plot indicating how a thermal plume can locally affect precipitation type from snow to rain. The form of precipitation perhaps impacting ground moisture levels in the future with rain running off, the snow more slowly melting and dissipating, producing conditions in which the snow melt water can experience higher absorption rates into the surround soil.
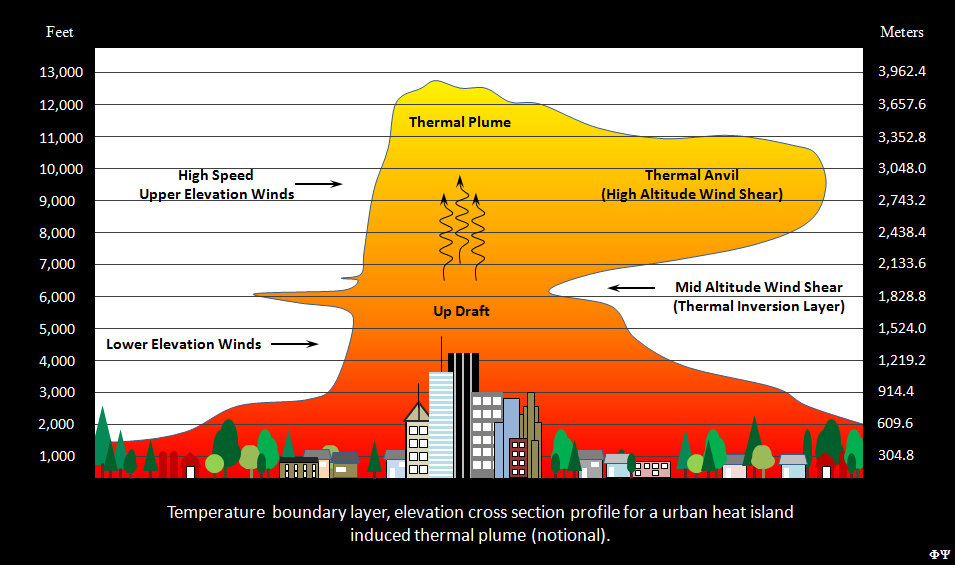
(Fig. 2) Cross section illustration of a notional (McGraw, 2014) heat island induced thermal plume over relatively flat land (xxxx, xxxx).[02] The rising heat plume (column of warm air), forming a high altitude thermal anvil directly downwind from the direction of the prevailing winds, anchored and pivoting like a wind vane about the thermal crest. The thermal plume's asymmetric, high aspect ratio shape, as seen from above the rising thermal plume pulling in warm air from the surrounding area much like a standing crest wave of water pulling with an under tow, water forward of the wave face.
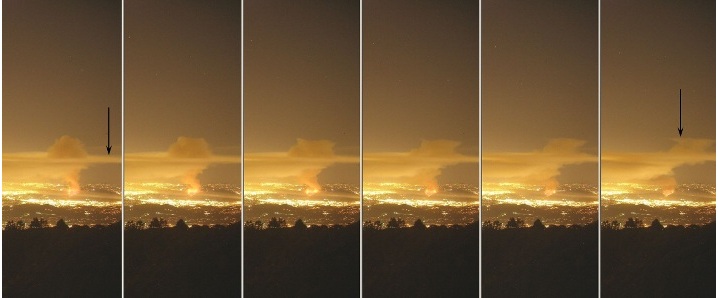
A good example of asymmetric thermal plume distribution patterns, can be viewed from time sequenced (minute increments) photographs of the Griffith Park, Mt. Hollywood fire in Los Angeles, 2011 (Fig. 3) as seen from the Mt. Wilson Solar Observatory camera about 10 miles distant to the east (Mt. Wilson Observatory, 2011; adapted, McGraw, 2012). These images and collected during an accentuated thermal plume condition, being the product of a large brush fire located on a mountain top surrounded by some low lying planes, clearing showing wind shear dynamics along two separate shearing elevation zones.
The velocity of the wind shears being in different directions and speed as evident by the stretched smoke (cloud) formations, the lower, more dense smoke mass visible in frame 1 (far left), having falling from the plume formation above the first shear zone (arrow) after first rising then cooling, sinking back towards the ground, translating with the wind towards the south (left).
The rising plume top in frame two, with more stored thermal energy than in frame one, the rate of thermal production below far exceeding the rate at which the local atmosphere can absorbed the increasing thermal energy, penetrating the second wind shear zone, resulting in a flattop smoke (cloud) formation to be produced atop. The winds above the first or lower shear zone, drifting less rapidly towards the north (right). The winds above the second shear zone and visible in frame six (far right, with arrow) translating towards the south (left) The dispersing pattern for the smoke plume, and representative of a rising thermal plume, increasing in area, expanding the effective zone of the concentrated heat island. The differential winds producing a non-circular (radially non-uniform), asymmetric thermal formation as seen from above or with doppler radar in situations of freezing precipitation pattern and associated precipitation form, such as snow, sleet and rain.
[03]
(Fig. 3) Time sequence photographs of the Griffith Park, Mt. Hollywood fire with smoke (cloud) based thermal plume formation. These images and accentuated thermal plume condition being the product of a large brush fire, clearing showing wind shear dynamics along two separate shearing elevations (arrows). The velocity of the shears being in different directions and speed as evident by the smoke formation (Mt. Wilson Observatory, 2011; adapted, McGraw, 2012). Estimate elevation of the smoke plume shear zones, per the local surroundings, being estimated to be 5,000'-7,000' feet (1500-2100 meters), Mt Hollywood being 1,625' ft (495.3 m) in height.[04]
Ultimately, the final shape (morphology) of the rising thermal plume, and its impact upon the local weather, being strongly affected by the nature of the local geography. Mountainous regions producing wind venturis and other forms of orographic effects that can confine and perhaps magnify what would otherwise be a relatively non impacting thermal signature into one that can alter the form of falling precipitation such as that observed on doppler radar over metropolitan Medford and Ashland Oregon. In more planar regions such as in the midwest United States, the more laminar nature of the winds moving across the ground surface, resulting in long, high aspect ratio, much less confined, thermal plume formations.
Speculating from anecdotal weather radar data, that in the case of metropolitan Minneapolis and St. Paul Minnesota, since the metro area is situated in a predominately flat region, less a fairly still, non windy day, resulting in reduced levels of altered or differential precipitation (rain as appose to snow falling) to form. For example, should it be snowing outside a given metro area, in planar, non mountainous regions have a greater possibility of snowing within the metro area. The opposite perhaps holding true for metro areas nested within mountains valleys or bowl like geographic topography, these regions being more prone or susceptible to orographic confinement, thus magnifying an urban thermal plume signature.
[05] [06]
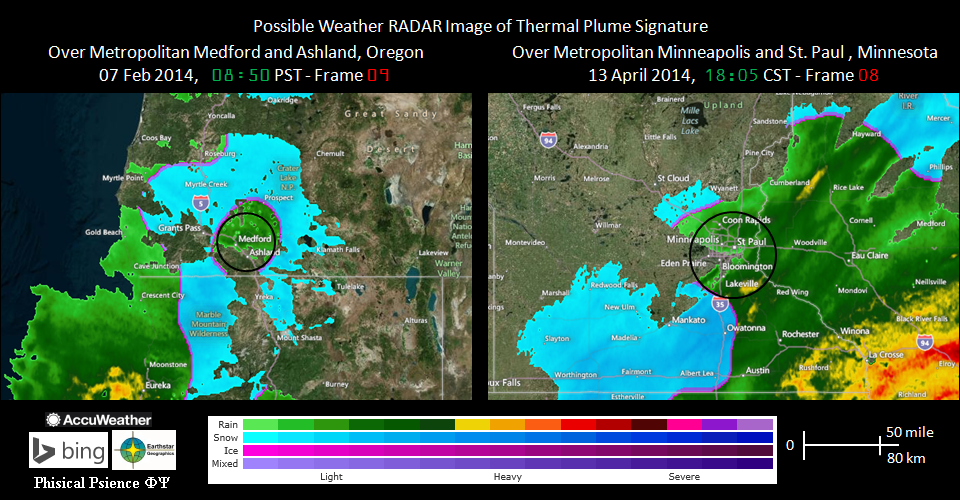
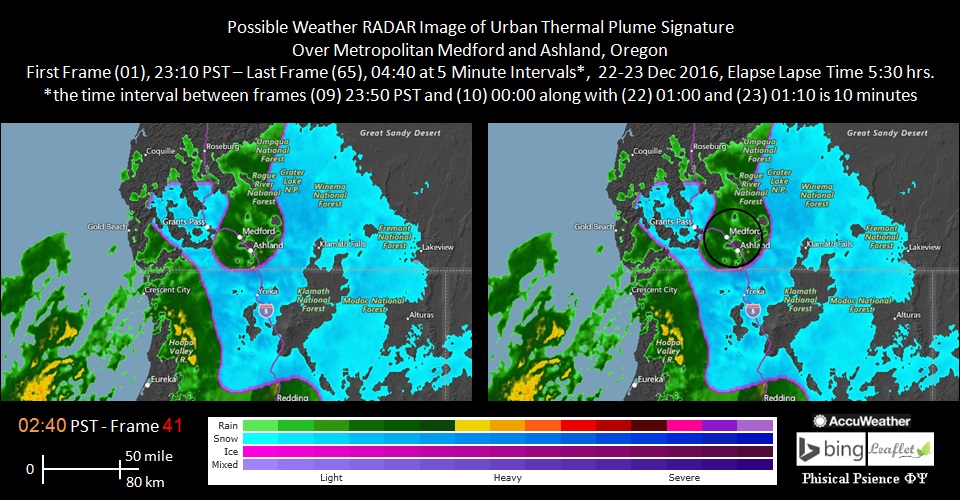
(Fig. 4) Weather RADAR images of a possible urban heat plume over metropolitan Medford and Ashland OR (left)(AccuWeather, 2014; Bing, 2014; Earthstar Geographics, 2014; adapted, McGraw, 2014).[07] in addition to metropolitan Minneapolis and St. Paul MN (right)(AccuWeather, 2014; Bing, 2014; Earthstar Geographics, 2014; adapted, McGraw, 2014).[08] Note the circular band of freezing rain and ice (purple) with a radius of about 10-20 miles (16-32 km) surrounding the Medford and Ashland region which is experiencing rain showers (green). The ring of freezing rain and ice further surrounded by cooler air and falling snow (blue). This region of Oregon and surrounded on all sides by mountainous terrain with relative elevation values greater than 2,000 feet (610 m) with respects to the encompassed plains on which the metro area exist,[09] appearing to be spatially orographic in nature.
Medford and Ashland Oregon
The following videos (Vids. 1, 2) spanning from 08:10 PST to 10:10 PST on 07 Feb 2014 (AccuWeather, 2014; Bing, 2014; Earthstar Geographics, 2014;)[10] and from 23:10 PST to 04:40 PST on 22-23 Dec 2016[11] display an urban thermal plume rising over the Medford Oregon metropolitan area. The thermal gradient of the atmosphere for a particular temperature range, one near the phase change point of water[12] and physical property that would otherwise be invisible to the operating frequency of weather radar, thermal emissions being in the near to far infrared optical band or upper terahertz region of the electromagnetic spectrum,[13] most weather radar devices operating in the megahertz to gigahertz region or near water absorption bands,[14] becoming visible, as cooling water vapor increases in size to form condensed water masses and latter into a solid as the water phase changes to ice and snow when cooled below freezing. The radio frequency (RF) absorption properties, thus the return signature of the atmosphere being unique to the type of precipitation and from the distribution of these forms can determine a tight, horizontal thermal cross section of the atmosphere's temperature as seen from above.
[15]
Above is a brief video (Vid. 1, 1.24 MB) of weather radar data spanning 2 hours, each frame representing a five minute interval, around the Medford and Ashland OR metro region (AccuWeather, 2014; Bing, 2014; Earthstar Geographics, 2014; adapted, McGraw, 2014).[16] This long duration, semi stationary, heat island induced atmospheric event, perhaps accentuated by the local mountainous terrain, thus and orographically enhanced thermal plume formation particular to the metro Medford and Ashland area. Below (Vid. 2, 1.68 MB) is a duplex framed, video of weather radar images with the possible thermal plume region over metropolitan Medford and Ashland OR indicated with a 36 mile diameter black circle (AccuWeather, 2014; Bing, 2014; Earthstar Geographics, 2014; adapted, McGraw, 2014).[17]
[18]
The image below (Fig. 5) is a duplex still frame (41) taken from (Vid. 4)[19] and presented further below, of an urban thermal plume rising over the metro Medford Oregon region captured at 02:40 PST on 23 Dec (AccuWeather, 2016; Bing, 2016; Leaflet, 2016; adapted, McGraw, 2016).[20] The radar signature of the urban thermal plume or heat island being similar in shape and dimension to the radar signature captured on 07 Feb 2014. The consistent nature between the two radar signatures and collected over 2.5 years apart, giving some indication that the thermal differential between the urban region and outlying areas along with the resulting rising plume maybe a constant atmospheric fixture above the metropolitan region.
[21]
The following two videos, spanning from frame 01, time 23:10 PST, to frame 65, 04:40 PST on 22-23 Dec 2016 (Vids. 3, 4)[22] showing a possible radar signature of an urban thermal plume (heat island effect) rising above metropolitan Medford and Ashland, Oregon.
[23]
Above is a brief video (Vid. 3, 1.80 MB) of weather radar data spanning 4 hours 30 minutes, each frame representing a five minute interval, around the Medford and Ashland OR metro region (AccuWeather, 2016; Bing, 2016; Leaflet, 2016; adapted, McGraw, 2016).[24] This reoccuring, semi fixed thermal plume and heat island .... Below (Vid. 4, 2.57 MB) is a duplex framed, video of weather radar images with the possible thermal plume region over metropolitan Medford and Ashland OR indicated with a 36 mile diameter black circle (AccuWeather, 2016; Bing, 2016; Leaflet, 2016; adapted, McGraw, 2016).[25]
[26]
Minneapolis and St. Paul Minnesota
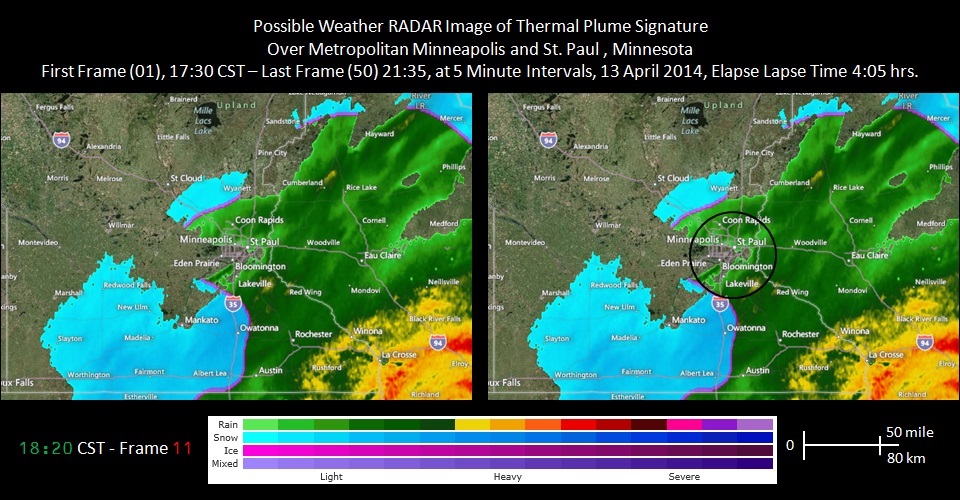
The image below (Fig. 6) is a duplex still frame (11) taken from (Vid. 6)[27] and presented below, of an urban thermal plume rising over metropolitan Minneapolis and St. Paul MN, collected at 18:20 CST on 13 Apr. 2014 (AccuWeather, 2014; Bing, 2014; Earthstar Geographics, 2014; adapted, McGraw, 2014).[28] Since the urban are around metropolitan Minneapolis is located on a fairly smooth terrain which is planar in nature and unlike the mountainous metro Medford OR region, the spatial radar signature of the urban thermal plume rising above metropolitan Minneapolis is greatly defined by the strength and direction of the prevailing wind, which at the time of data collection was from the south west. Thus the air flow passing over the urban area is semi laminar in nature and throughout a fairly large elevation range as measured from ground level, thus the thermal plume tends to have less spatial form duration and elongated in shape as seen from above.
[29]
The following two videos, spanning from frame 01, time 17:05 CST to frame 50, 21:35 CST on 13 Apr 2014, present a possible radar signature of an urban thermal plume rising above amd drifting away from the Minneapolis and St. Paul Minnesota metropolitan area (Vids. 5, 6).[30] The winds dispersing the plume, thus elongating the plume as seen from above, coming from the southwest moving to the north east.
[31]
Above is a video (Vid. 5, 2.64 MB) of weather radar images around the Minneapolis and St. Paul MN metro region (AccuWeather, 2014; Bing, 2014; Earthstar Geographics, 2014; adapted, McGraw, 2014)[32]... Below is a duplex framed, video (Vid. 6, 3.57 MB) of weather radar images with the possible thermal plume region over metropolitan Minneapolis and St. Paul MN indicated with a 45 mile diameter black circle (AccuWeather, 2014; Bing, 2014; Earthstar Geographics, 2014; adapted, McGraw, 2014)[33].
[34]
The rising thermal plume signature collected from doppler weather radar for metropolitan Minneapolis and St. Paul, coinciding nicely with the surface "heat island" image recorded from the NASA GOES satellite infrared camera (Fig. 7), post snow fall (NASA, 2001).[35] The type of precipitation received in the warmer urban zones with higher ground temperatures, thus prone to melting more rapidly, being not just snow, but also rain and sleet, and as such, more quickly displaced from the surface.[36]
[37]
(Fig. 7) Visible (left) and infrared (right) satellite images spanning the state of Minnesota, recorded post snow fall. The Mississippi River (dark meandering line) and metropolitan area of Minneapolis and St. Paul (prominent dark region) at lower right center being warmer than the surrounding region (NASA GOES, 2001; adapted, McGraw, 2014). The diameter of the heat island or thermal signature of Minneapolis - St. Paul, minus the wind induced drift, matching well with the diameter of the thermal plume signature collected from weather radar.[38]
Each of the lesser dark spots surrounding metro Minneapolis and St. Paul being urban areas reduced in magnitude, such as Duluth MN (1:30 position), Eau Claire WS (3:00), Rochester MN (4:30), Mason City IA (6:30), Mankato MN (7:00), St. Cloud MN (10:30).[39] All of these secondary urban signatures with their corresponding dark spot in the infrared image, equating to a separate heat island, each urban heat island producing a rising thermal plume in proportion to their thermal signatures, or thermal emission.
 [03]
[03]
 [05] [06]
 [21]
[21]
 [29]
[29]
 [37]
[37]